

As we celebrated our fifth anniversary, we wanted to dedicate time to a focused initiative outside of our usual work, using our math and programming skills to build something meaningful for the public good.
Public transport is a lifeline for many people, vital not just as an alternative to cars, but as a foundation of accessible and sustainable mobility. Yet too often, transit planning is limited by outdated methods, political considerations, or budget constraints. We asked ourselves: how can we use data to help improve this?
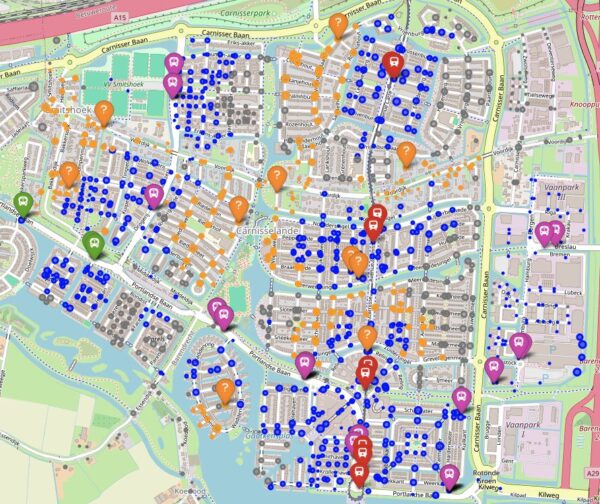
During our “Do Some Good” week, we focused on improving public transport accessibility. Our goal was to identify underserved areas: places where people live but are more than a five-minute walk from the nearest bus or train stop.
A Data-Driven Approach
To tackle this challenge, we built a model based entirely on open data and open-source software. Using OpenStreetMap, OSMnx, and Folium, we mapped out the current situation: where existing stops are located, how far people have to walk, and where new stops could increase coverage.
The process began with questions like: What defines an effective stop? Where can it do the most good? And how do we communicate those insights clearly? By combining population data with geographic information, our model suggests optimal new stop locations based on accessibility and density.
Testing Across Countries
After building the model, we tested it in several cities across the Netherlands and Germany. This real-world validation was essential. Working with areas we knew helped us quickly spot when the model’s suggestions didn’t quite make sense, such as placing new stops in forest paths, farmland, or near a wellness resort.
These edge cases highlighted important limitations and gave us ideas for improvements. For example, filtering locations based on land-use tags (like “residential” or “commercial”) helps the model avoid suggesting stops in areas with no housing. We also saw value in incorporating elevation data, since steep terrain can significantly affect walking effort and time. Additionally, refining how we use postal code data can help us better represent population distribution, leading to more accurate estimates of how many people can realistically reach a stop within a certain walking distance.
The Power of Open Data & Software
We believe data-driven approaches like this can help make public transport planning more transparent, equitable, and effective. With Python packages like OSMnx and Folium, we could efficiently extract, analyze, and visualize the data, transforming it into meaningful insights. These tools (alongside others) enabled us to develop a working model to improve public transport accessibility in less than a week, something that would have been far more challenging without them.
If you work in mobility, urban planning, or are just curious about what we’ve done, feel free to reach out, we’d love to share more.